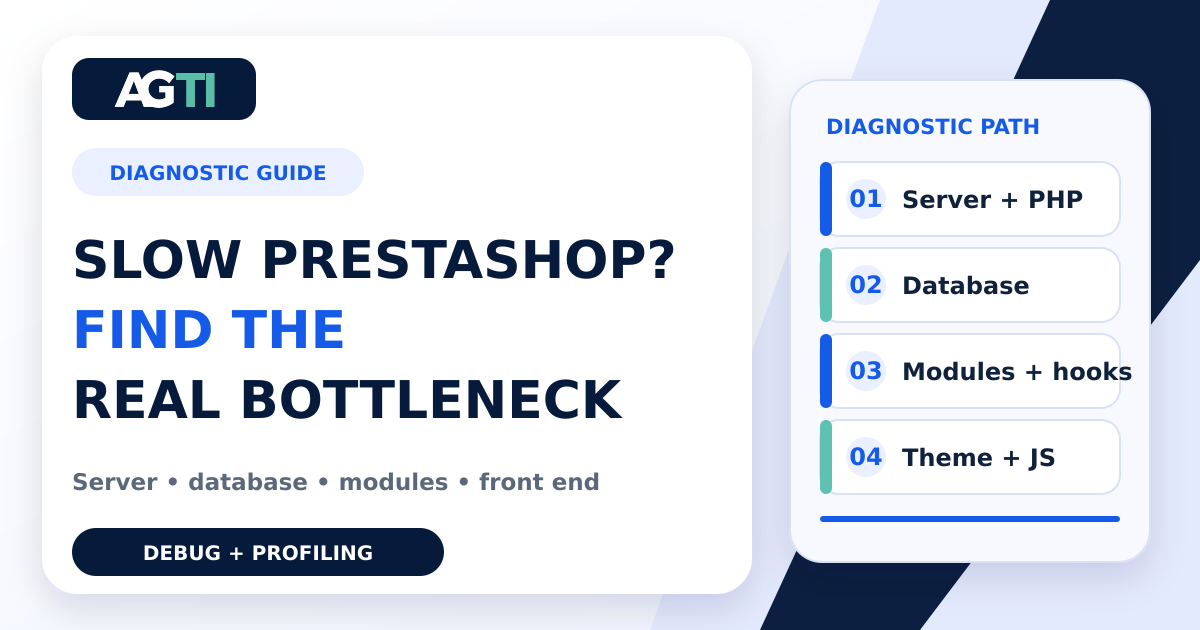
Slow PrestaShop store: how to find whether the bottleneck is the server, database, modules, or front end
When a PrestaShop store becomes slow, infrastructure is often blamed first. Upgrading CPU and memory can help when the origin is genuinely saturated, but it can also hide an application bottleneck without removing it. An unindexed query, an expensive hook, a module calling a remote API during page rendering, or heavy third-party JavaScript may remain the limiting factor on a larger server.
A useful diagnosis begins by splitting “slow” into observable symptoms. A store may take too long to send its first byte and then render normally. It may deliver HTML quickly but freeze when the shopper interacts. It may be fast for anonymous visitors and slow for signed-in customers. It may degrade only during traffic peaks or scheduled jobs.
These scenarios belong to different layers. This guide provides a repeatable method for identifying where the time is spent before choosing a fix.
Start by defining what is slow
A five-second page load is not yet a diagnosis. The delay can happen before the origin responds or after the browser receives the HTML.
Separate at least four signals:
- Time to First Byte (TTFB): includes network latency, origin processing, and the wait until the first response byte. High TTFB points toward routing, the web server, PHP, the database, modules, or upstream services.
- Largest Contentful Paint (LCP): describes when the main visible content is rendered. Large images, render-blocking CSS, fonts, and resource priority affect it.
- Interaction to Next Paint (INP): measures responsiveness to user interactions. Large JavaScript tasks and excessive event handling can make a page look ready while still reacting slowly.
- Cumulative Layout Shift (CLS): captures unexpected layout movement, often caused by images, banners, and recommendation widgets without reserved space.
Google’s good-experience reference values are LCP within 2.5 seconds, INP below 200 milliseconds, and CLS no higher than 0.1. They are not a business diagnosis on their own, but they help distinguish loading, responsiveness, and visual stability. See Google’s Core Web Vitals documentation.
Test different routes. The home page, category, product, search, cart, checkout, and back office execute different controllers, hooks, queries, and integrations. A domain-wide average can hide a slow product page or an order screen that degrades as the database grows.
Build a reproducible baseline
Record a baseline before changing a module, cache setting, or server. Otherwise, an apparently faster result may simply come from warm caches, lower traffic, or a different network route.
A practical baseline includes:
- URL and page type;
- date, time, and approximate traffic level;
- anonymous or authenticated session;
- cold-cache and warm-cache runs;
- TTFB, total duration, and response size;
- real-user LCP, INP, and CLS when enough field data exists;
- CPU, memory, swap, and disk I/O during the request;
- query count and total database time;
- PrestaShop, PHP, theme, and relevant module versions.
Run the same scenario several times. Median values describe the common experience; upper percentiles reveal the slow tail. A median of 800 ms with a p95 of eight seconds is not healthy—it is merely fast most of the time.
Layer 1: DNS, connection, TLS, and CDN
If the browser spends a long time establishing a connection, the delay may occur before PrestaShop runs. In a controlled environment, compare the public domain with the origin, then inspect DNS lookup, TCP connection, TLS negotiation, redirects, and geographic distance.
Common warning signs include:
- multiple redirects before the final URL;
- an origin far from the main customer base;
- intermittent failures limited to a carrier or region;
- static assets repeatedly fetched from the origin;
- ineffective browser-cache headers for images, CSS, and JavaScript;
- inconsistent DNS, IPv6, or certificate configuration.
A CDN can move static content closer to visitors and reduce origin load, but it does not automatically repair slow PHP or inefficient SQL. Cache rules must also preserve personalized behavior: account, cart, and checkout responses cannot be treated as identical public pages.
Layer 2: the server, PHP-FPM, and storage
If TTFB grows together with CPU utilization, PHP-FPM queues, swap usage, or disk wait, investigate infrastructure. Total RAM alone is not enough; the relevant question is which resource becomes saturated when latency rises.
CPU and PHP workers
High CPU can result from legitimate traffic, bots, scheduled tasks, image regeneration, indexing, or costly code that runs on every request. Determine whether PHP-FPM workers are fully occupied and whether requests wait for a free child process.
Do not raise pm.max_children without estimating real per-process memory. Too many children can turn a queue problem into memory exhaustion. Once the host begins swapping, latency can increase abruptly.
OPcache
OPcache stores precompiled PHP bytecode in shared memory so scripts do not need to be loaded and compiled on every request. Confirm that it is enabled for the SAPI serving the shop, that its memory is not exhausted, and that the file capacity matches the application. The PHP OPcache manual explains its role and configuration.
Copied settings are not a diagnosis. An undersized cache, frequent restarts, or unsuitable validation settings can reduce the benefit.
Disk and I/O
Backups, verbose logs, file-based sessions, compiled templates, and a database on the same volume can compete for I/O. Low CPU does not necessarily mean an idle server; processes may be blocked waiting for storage. Inspect disk latency and queue depth during the actual slowdown.
Layer 3: PrestaShop production settings
Before looking for an exotic failure, verify that development settings are not active in production.
Review:
- production mode and error display;
- Smarty compilation and template cache;
- controlled cache invalidation after deployments;
- CSS and JavaScript combining/minification tested with the active theme;
- disabled developer toolbars and diagnostic modules;
- production-appropriate logging levels.
PrestaShop’s documentation recommends disabling _PS_MODE_DEV_ and _PS_DEBUG_PROFILING_ in production and avoiding forced Smarty compilation. See the official PrestaShop performance recommendations.
Clearing every cache continuously is not a performance strategy. The first requests after a purge pay the compilation and rebuilding cost again. Invalidation should follow actual code, theme, configuration, or content changes.
Debug mode and native profiling are different tools
Debug mode and profiling are both useful, but they answer different questions.
_PS_MODE_DEV_ exposes development errors and diagnostic information. It is useful for finding exceptions, compatibility problems, warnings, and failures hidden by a generic error page. It is primarily a functional debugging tool.
_PS_DEBUG_PROFILING_ adds profiling information to page processing. Depending on the PrestaShop version and executed route, it can surface indicators such as total execution time, memory, SQL queries, loaded files, and hook execution. This makes it valuable when two similar pages behave differently or when one route suddenly generates many more queries.
On installations that use config/defines.inc.php, profiling is commonly enabled temporarily with:
if (!defined('_PS_DEBUG_PROFILING_')) {
    define('_PS_DEBUG_PROFILING_', true);
}
Restore it as soon as the capture is complete:
if (!defined('_PS_DEBUG_PROFILING_')) {
    define('_PS_DEBUG_PROFILING_', false);
}
A controlled profiling workflow
Profiling adds overhead, so its timings are not equivalent to normal shopper experience. Use the output to compare relative cost and composition: which query family dominates database time, which hook is expensive, which page loads more files, and whether a change removes repeated work.
A safe workflow is:
- reproduce the issue without profiling and save the baseline;
- use staging with representative data whenever possible;
- if production is unavoidable, restrict access and use a short maintenance window;
- profile one representative request and save the output;
- disable profiling immediately;
- form one hypothesis, apply one change, and rerun the normal baseline.
Do not leave debug mode or profiling enabled on a live storefront. Besides adding work, diagnostic output may disclose technical details, paths, and queries. PrestaShop explicitly recommends keeping both flags disabled in production.
How to read the profiler
- A high number of small queries: look for N+1 access patterns, repeated configuration reads, loops, or hooks called multiple times.
- A few very slow queries: inspect missing indexes, low-selectivity filters, sorting, and large tables.
- Time concentrated in hooks: map the hook to registered modules and test each candidate in staging.
- Unusually high memory: inspect large collections, excessive object hydration, exports, or image work performed inside the web request.
- Large differences between routes: compare modules, blocks, product combinations, and remote services used on those pages.
The profiler identifies where to investigate; it does not always reveal the root cause by itself. A query can be slow because storage is overloaded, and a hook can be slow because it waits for a remote API.
Layer 4: the database
Over time, stores accumulate orders, carts, connections, search data, logs, and module-specific tables. A query that was harmless with a small catalog can become critical years later.
Enable the slow query log for a controlled period and rank findings by frequency, duration, and rows examined. The MySQL Slow Query Log documentation describes the feature and its settings. Do not focus only on the single longest query: a 100 ms query executed thousands of times can consume more capacity than an isolated two-second query.
For each candidate, inspect:
- the
EXPLAINexecution plan; - indexes used and estimated rows;
- shop, language, customer-group, and status filters;
- large
JOIN,ORDER BY, andGROUP BYoperations; - repeated queries with identical parameters;
- log or module tables without retention policies;
- lock waits and long transactions.
Avoid creating indexes by trial and error. Every index consumes storage and adds write cost. It should support a measured, frequent query.
Layer 5: modules, hooks, overrides, and external services
Modules extend PrestaShop through specific execution points. A module may be cheap on the home page and expensive on product pages. Another may request remote inventory or shipping data during checkout. Some execute logic even when their visual block is not displayed.
In staging, relate expensive hooks to registered modules. Disable one candidate at a time, repeat the same request, and compare. Changing several components together prevents you from identifying which change mattered.
Pay special attention to:
- synchronous HTTP calls without strict timeouts;
- shipping, payment, recommendation, analytics, or ERP APIs in the rendering path;
- queries inside product or combination loops;
- repeated configuration loading;
- old overrides that duplicate core work;
- abandoned or incompatible modules;
- heavy jobs that belong in cron or a queue.
An external system should not hold the storefront indefinitely. Define timeouts, fallback behavior, and caching when the data permits it. Work that does not need to complete before the browser response should run asynchronously.
Layer 6: theme, images, and JavaScript
When TTFB is healthy but LCP or INP remains poor, move the investigation to the browser.
A large hero image can dominate LCP. Render-blocking stylesheets delay the first useful paint. Marketing tags, chats, pixels, A/B testing, and widgets can keep the main thread busy after the HTML arrives.
Review:
- actual image bytes and formats delivered to each viewport;
- responsive images and
srcset; - priority for the main image and lazy loading below the fold;
- critical CSS and render-blocking resources;
- JavaScript volume and long tasks;
- third-party scripts by cost and business value;
- reserved dimensions for dynamic blocks;
- the number of visual modules on the home page.
Do not optimize for a single score. Read the individual findings and validate the result in real sessions. A change that improves a lab score while breaking personalization, tracking, or checkout is not an improvement.
Symptom-to-layer checklist
| Symptom | First checks |
|—|—|
| High TTFB on every route | PHP-FPM, OPcache, database, production flags, external services |
| Only products or categories are slow | hooks, modules, combinations, route-specific queries and images |
| Order screens are slow in back office | data volume, admin modules, integrations, SQL plans |
| Fast outside peak periods | worker saturation, CPU, database, disk, concurrency |
| HTML is fast, visual rendering is slow | images, CSS, JavaScript, third parties |
| Page looks ready but interactions lag | INP, long tasks, event handlers |
| Intermittent latency | remote APIs, cron jobs, bots, locks, I/O, network |
| Restarting PHP helps temporarily | pool saturation, memory growth, OPcache, persistent processes |
A diagnostic sequence that limits wasted work
- Measure representative routes and separate origin latency from browser work.
- Correlate slow periods with CPU, memory, swap, disk, and PHP workers.
- Confirm production configuration, cache behavior, and OPcache.
- Use debug mode and native profiling in a controlled window to identify suspicious queries and hooks.
- Analyze the slow query log and execution plans.
- Test modules and integrations individually in staging.
- Review images, CSS, JavaScript, and third parties.
- Change one cause at a time and repeat the baseline.
- Monitor after deployment for peaks and regressions.
This avoids two expensive mistakes: upgrading infrastructure without evidence and applying many “optimizations” simultaneously. Both increase cost while preserving uncertainty.
Conclusion
PrestaShop performance is not one setting. It is the combined result of network routing, the origin server, PHP, database access, modules, remote integrations, and browser-side execution.
Debug mode and native profiling are valuable parts of the investigation when used briefly, preferably in staging, and disabled immediately afterward. They turn “the store is slow” into testable hypotheses: too many queries, an expensive hook, excessive memory, a blocking external service, or a bottleneck that begins only in the browser.
Measure before purchasing more infrastructure. Compare before disabling modules at random. Repeat the same scenario before declaring that an optimization worked.
AGTI diagnoses and optimizes PrestaShop stores by treating application code, database behavior, modules, and infrastructure as one operational system. If your store is slow, unstable, or degrades under peak load, contact our team for an evidence-based assessment.